指标
在指标领域,基于 Prometheus 的指标收集与存储,已经是事实上的标准,因此本节内容主要围绕 Prometheus 做简要的介绍。
指标的收集
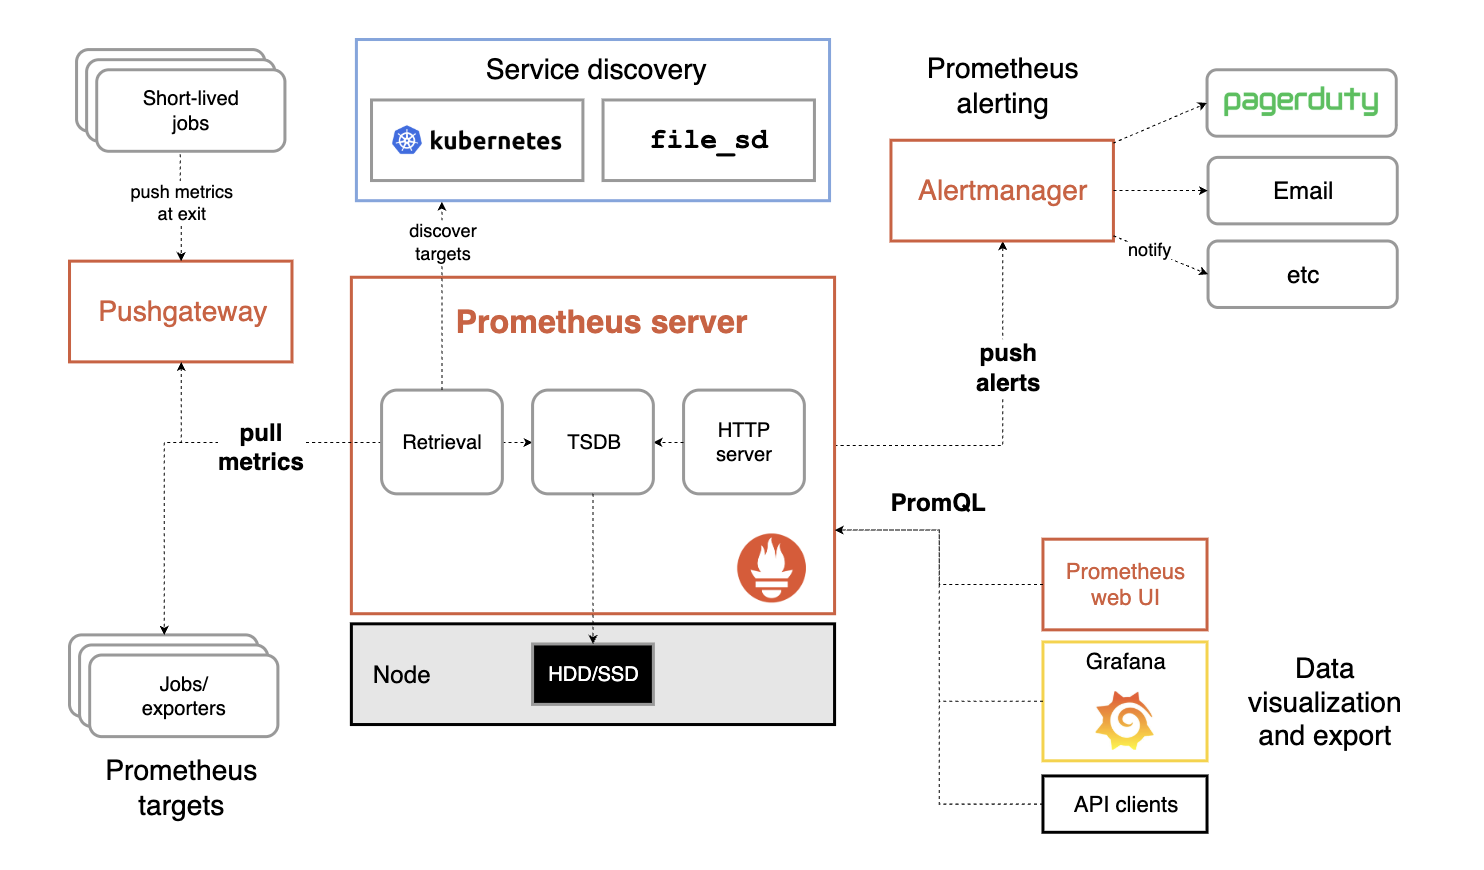
Prometheus 整体架构如图,其通过 pull(拉取)的方式收集被监控对象的指标数据,并将其存储在 TSDB(时序数据库)中。在配合 Grafana 和 AlertManager,实现数据的可视化和告警。
围绕指标的收集,Prometheus 使用 Exporter 作为系统与被监控对象之间的桥梁,由 Exporter 实现具体的指标收集并暴露 /metrics 接口,供 Prometheus 拉取。比如下面是 Node Exporter 收集主机 CPU 指标的示例:
$ curl http://127.0.0.1:9100/metrics | grep node_cpu_seconds_total
# TYPE node_cpu_seconds_total counter
node_cpu_seconds_total{cpu="0",mode="idle"} 20373.99
node_cpu_seconds_total{cpu="0",mode="iowait"} 83.54
node_cpu_seconds_total{cpu="0",mode="irq"} 0
node_cpu_seconds_total{cpu="0",mode="nice"} 8.43
node_cpu_seconds_total{cpu="0",mode="softirq"} 39.88
node_cpu_seconds_total{cpu="0",mode="steal"} 0
node_cpu_seconds_total{cpu="0",mode="system"} 541.81
node_cpu_seconds_total{cpu="0",mode="user"} 691.72

node_cpu_seconds_total{cpu="1",mode="idle"} 20385.7
node_cpu_seconds_total{cpu="1",mode="iowait"} 77.39
node_cpu_seconds_total{cpu="1",mode="irq"} 0
node_cpu_seconds_total{cpu="1",mode="nice"} 5.83
node_cpu_seconds_total{cpu="1",mode="softirq"} 52.55
node_cpu_seconds_total{cpu="1",mode="steal"} 0
node_cpu_seconds_total{cpu="1",mode="system"} 536.77
node_cpu_seconds_total{cpu="1",mode="user"} 677.49
目前围绕 Prometheus 已经有了大量的 Exporter,涵盖了常见的数据库、中间件、硬件等几乎所有需要的收集的对象。
| 范围 | 常用 Exporter |
|---|---|
| 数据库 | MySQL Exporter、Redis Exporter、MongoDB Exporter、MSSQL Exporter 等 |
| 硬件 | Apcupsd Exporter、IoT Edison Exporter、IPMI Exporter、Node Exporter 等 |
| 消息队列 | Beanstalkd Exporter、Kafka Exporter、NSQ Exporter、RabbitMQ Exporter 等 |
| 存储 | Ceph Exporter、Gluster Exporter、HDFS Exporter、ScaleIO Exporter 等 |
| HTTP 服务 | Apache Exporter、HAProxy Exporter、Nginx Exporter 等 |
| API 服务 | AWS ECS Exporter、Docker Cloud Exporter、Docker Hub Exporter、GitHub Exporter 等 |
| 日志 | Fluentd Exporter、Grok Exporter 等 |
| 监控系统 | Collectd Exporter、Graphite Exporter、InfluxDB Exporter、Nagios Exporter、SNMP Exporter 等 |
| 其它 | Blockbox Exporter、JIRA Exporter、Jenkins Exporter、Confluence Exporter 等 |
指标的类型
监控系统中,虽然我们需要收集的指标可能有成千上万个,但指标类型(Metric Type)却是固定的。Prometheus 定义了如下四种指标类型。
Counter 计数器
这是最好理解的指标类型了,它通过累加求和,计算某个指标总数或者事件发生的次数。比如 QPS、日活月活、销售额等,都属于此类指标。
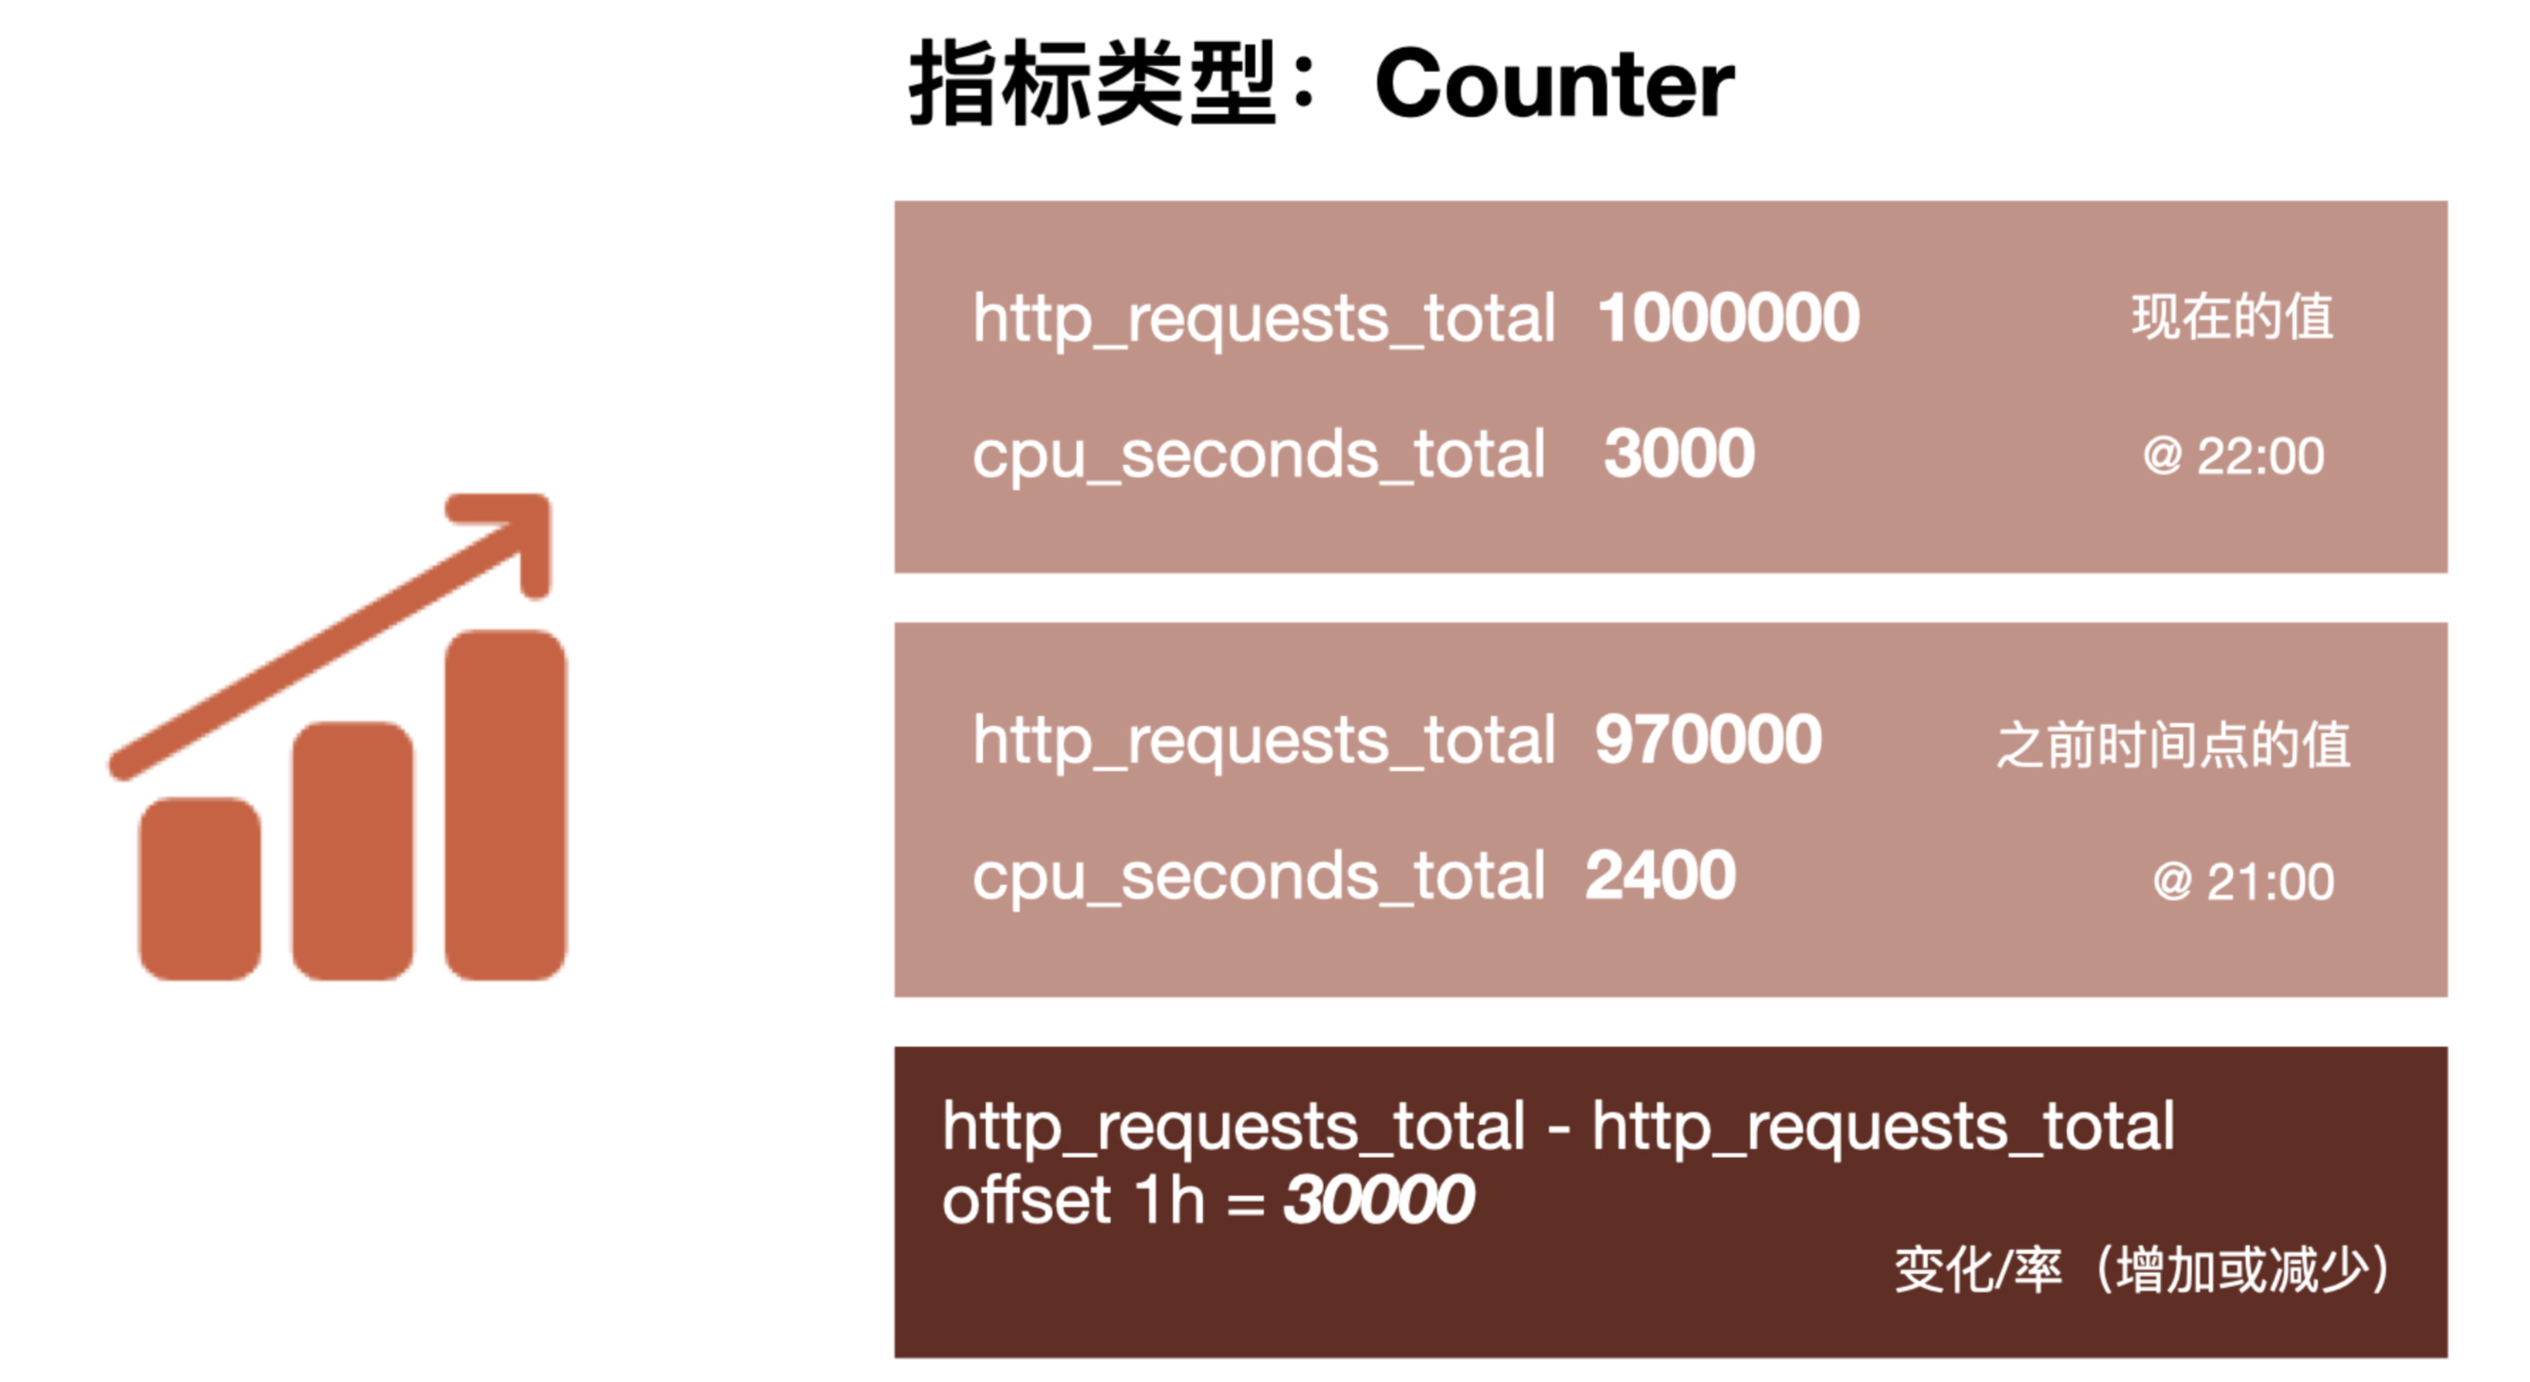
在计数器指标的基础上还可以做进一步的聚合计算处理,比如 Prometheus 支持对计数器指标进行 rate(速率)、top 等计算函数。
# 通过rate()函数获取HTTP请求量的增长率:
rate(http_requests_total[5m])

# 查询当前系统中,访问量前10的HTTP地址:
topk(10, http_requests_total)
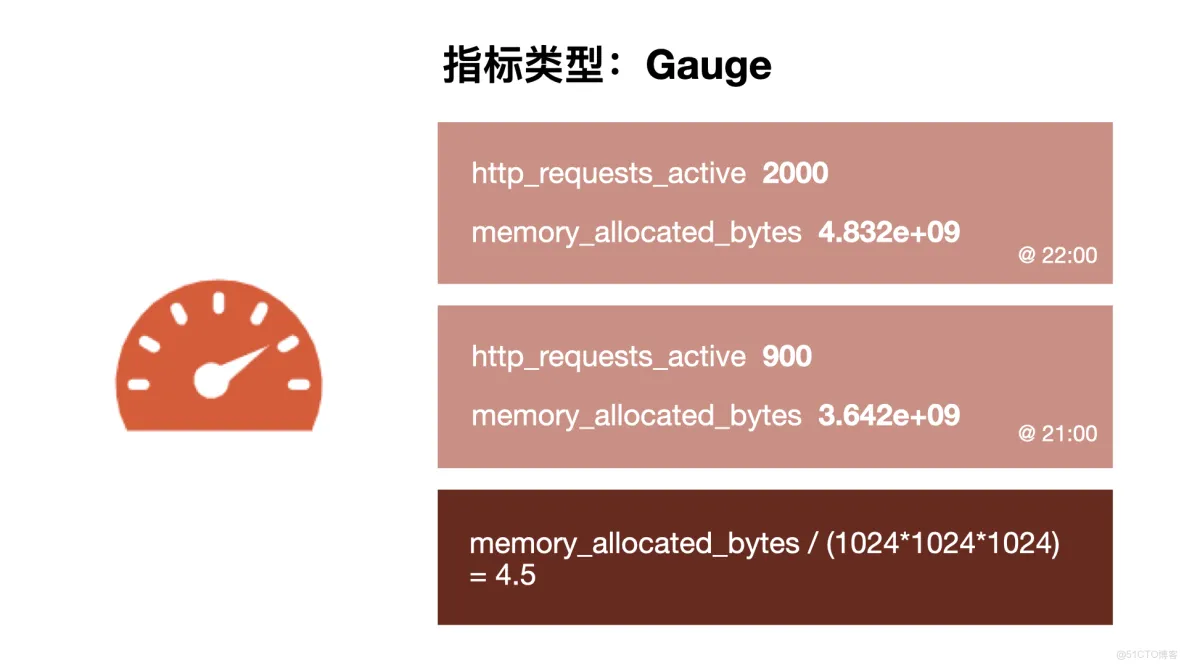
Guage 仪表盘
瞬态仪表盘,主要用来展示系统当前的状态。比如当前的内存使用量,生活中我们开车时的车速就属于此类指标。
因为此类指标也都是带时间戳的,因此收集后相当于对系统状态的采样集合。虽然单个值只代表当时的系统状态,但却可以根据这些数据做进一步的计算。像 Prometheus 提供了 delta() 函数可用来计算样本在一段时间内的变化情况; predict_linear() 函数可以对未来的值进行预测,比如对磁盘可用空间进行预测,从而提前预警;
Histogram 直方图
和上述两者都属于数值类的指标不同。直方图和接下来要介绍的 Summary 摘要是统计类型的指标。直方图用来表示指标在不同区间的分布情况。比如上学时,我们按 90 ~ 100,80 ~ 89,70 ~ 79、60 以下等区间来统计成绩分布。
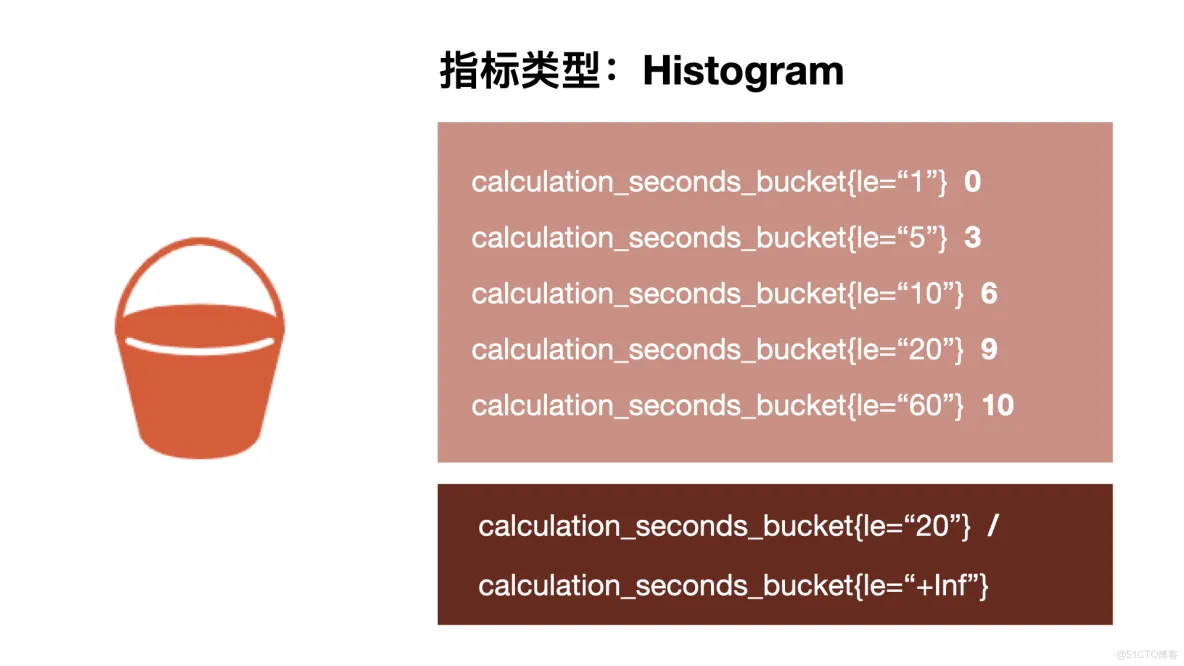
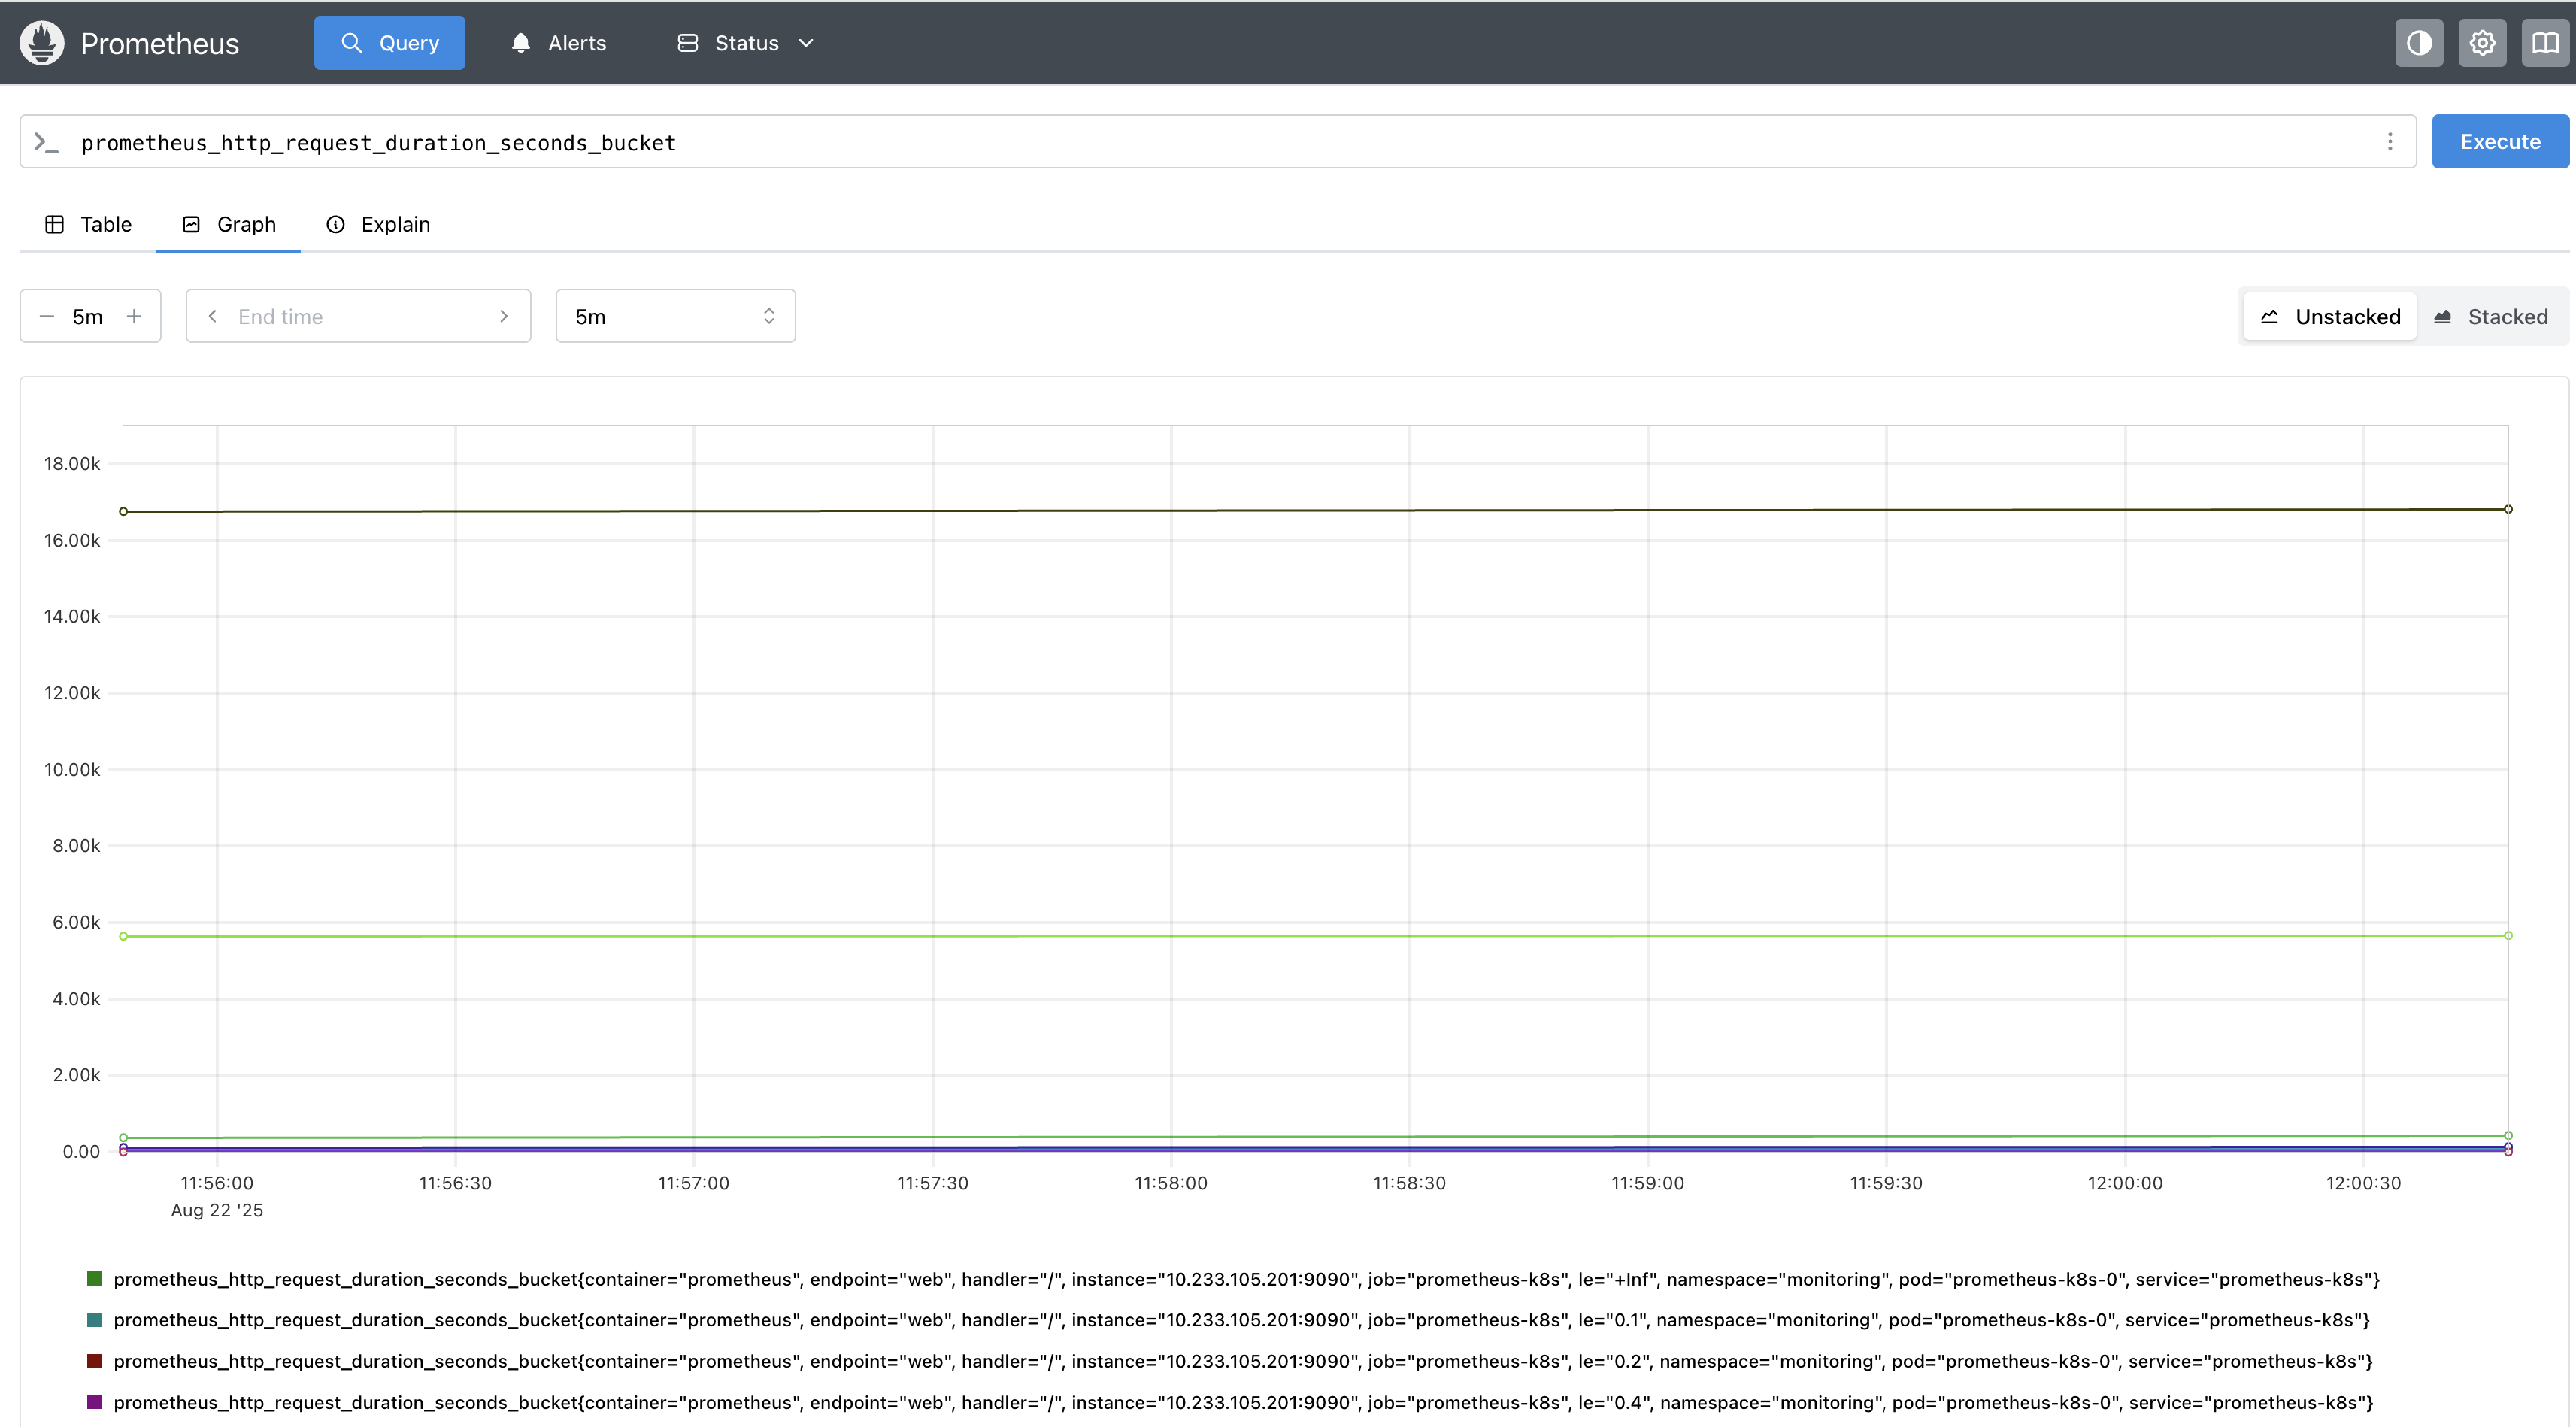
需要注意的是,Prometheus 的直方图只有上区间,没有下区间。以 prometheus_http_request_duration_seconds_bucket 为例,其代表请求耗时在不同区间的分布情况。le 为 0.4 是包含了 le 为 0.1 的数据的。也就是说 le 0.1 代表耗时 0 到 0.1s 之间的请求个数;而 le 0.4 则代表耗时 0 到 0.4s 之间的请求个数,如果要求 0.3s ~ 0.4s 之间的请求耗时,需要做相应的运算才行。
Prometheus 还提供了众多的函数可以对直方图数据做进一步的处理,比如 histogram_fraction() 函数可以用来计算某个区间内的数据占比,我们可以用它来求 P99、P50 等数据;histogram_quantile() 函数可以用来计算某个分位数的值。
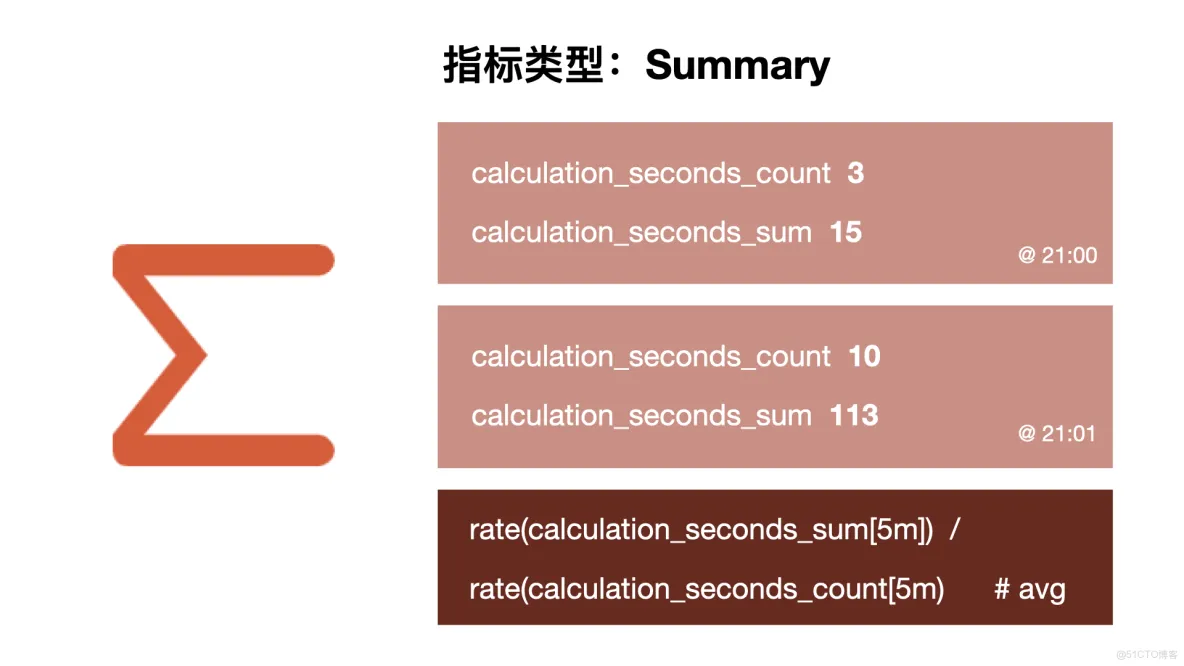
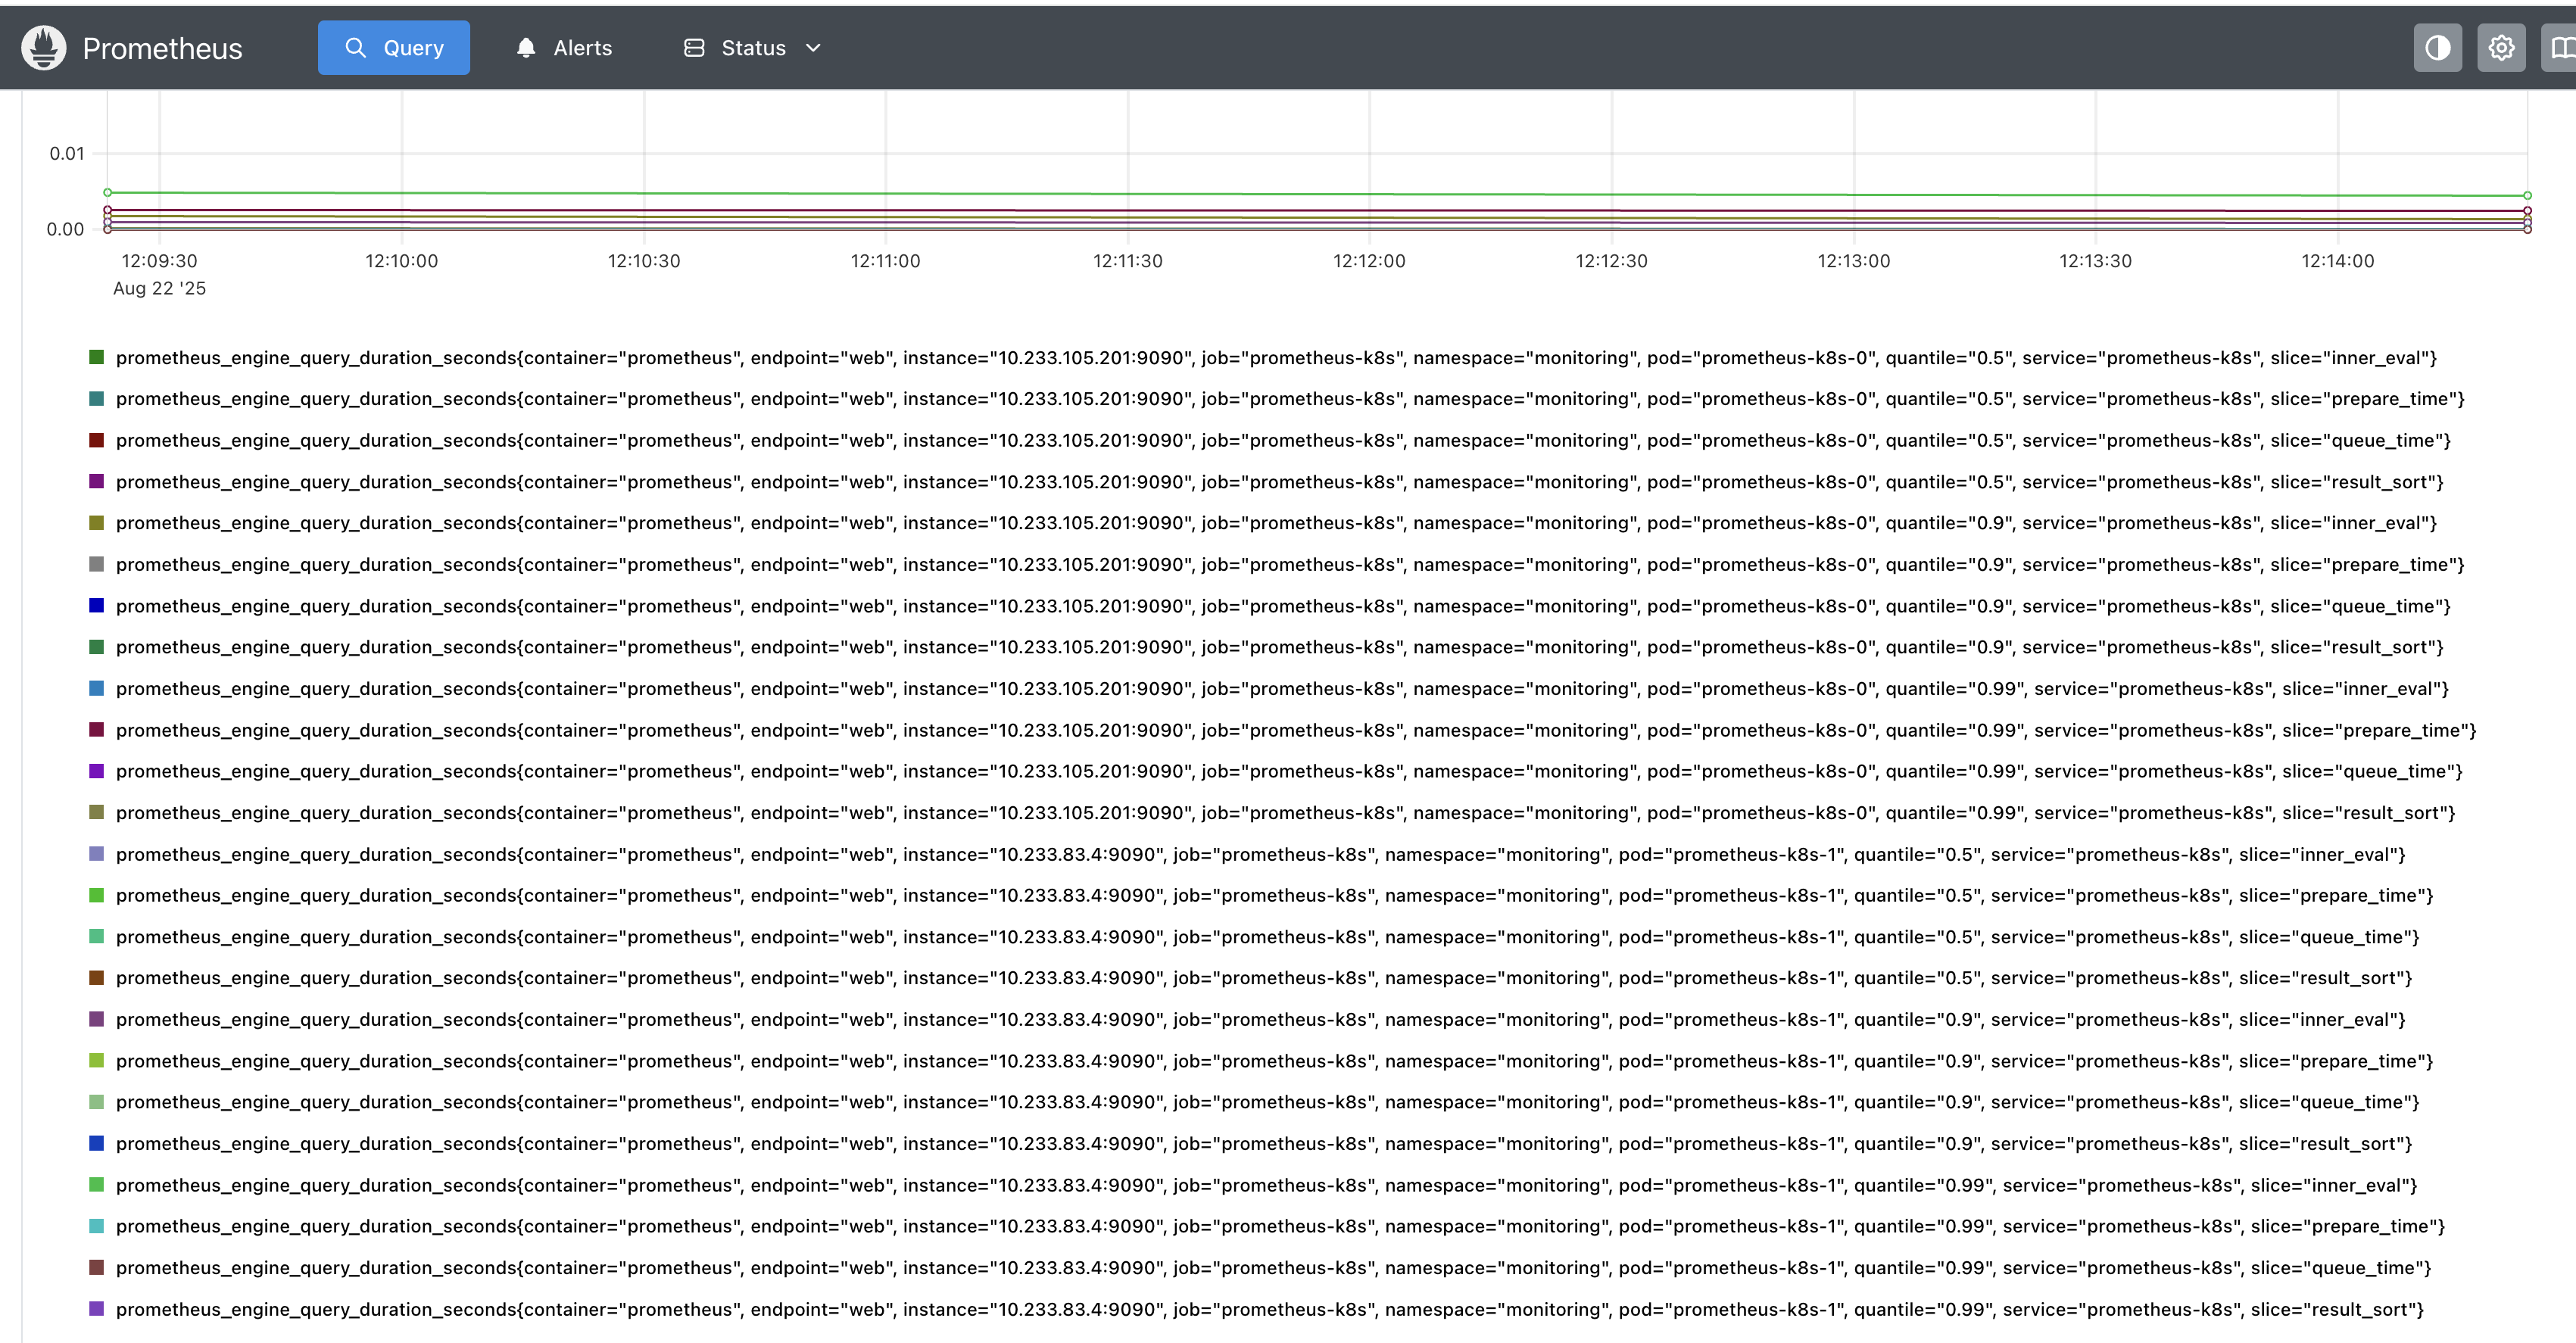
Summary 摘要
Summary 也是统计数据的分布情况,但和直方图基于区间统计不同,Summary 计算的是百分比,比如请求的 P90、P99。
指标的存储
Prometheus 指标的格式如下:
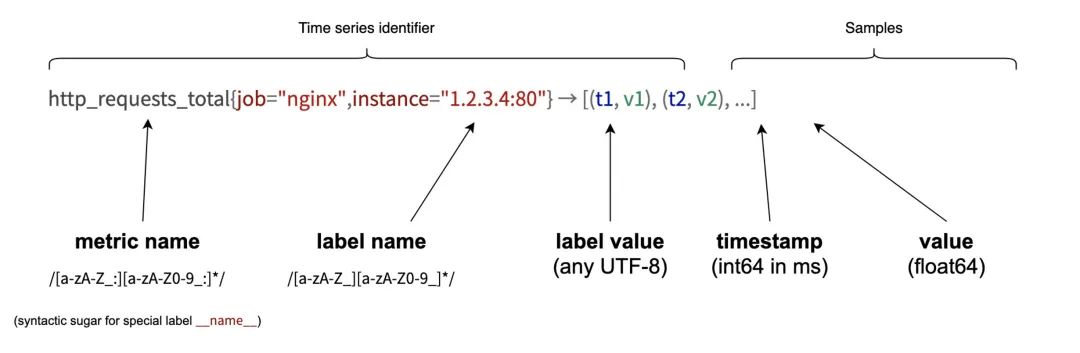
每个指标由四部分组成:
指标名:表示这个指标是监控哪一方面的状态,比如 http_request_total 表示请求数量,memory_usage 表示内存使用量等。
标签集合:{<label1=v1>,<label2=v2>....},用来区分指标的表示维度。比如响应是 200 的请求还是 500 的请求;A 服务器的指标还是 B 服务器的指标。
时间戳:描述当前时间序列的时间,单位:毫秒。
样本值:当前监控指标的具体数值。
上述格式组成一个时间序列,其数据集的大小受标签维度的复杂性和采样的实时性影响,很容易导致数据爆炸。
假设我们有一个小型集群,该集群有 15 个节点,运行着 20 个微服务系统。每个节点需要采集 CPU、GPU、内存、磁盘和网络等资源使用情况,每个服务则需要采集业务相关和中间件相关的指标。假设我们每 5s 采集一次指标,仅 node_memory_MemFree_bytes 一条数据,一天就要采集 15(节点)* 1(指标)* (3600 * 24 / 5)(一天采集次数) = 259,200 条数据。一旦指标数增加,那每天需要采集的数据可能有上亿条,数据大小以 TB 记,这对存储提出了巨大的挑战。
针对上述时序数据的特点,业界发展出了专门用来存储该类数据的数据库-时序数据库(Time-Series Database,简称 TSDB),通过使用 LSM-Tree 数据结构、数据压缩、定时删除等策略,尽可能的减少要存储的数据量。
Prometheus 本身就内置了强大的时序数据库,但其也支持配置 InfluxDB 等第三方 TSDB 作为存储后端。
指标的查询展示与告警
Prometheus 提供了 PromSQL 作为查询语言,我们可以通过编写 PromQL 查询来获取和处理监控数据。下面是一些查询实例:
node_memory_MemFree_bytes查询某个指标的瞬态值。node_memory_MemFree_bytes{instance="tk04"}根据过滤条件查询。node_memory_MemFree_bytes{instance=~"tk.*"}根据正则表达式查询。
Prometheus 还提供了众多函数来对数据做进一步处理,实际工作中可以根据需要使用。
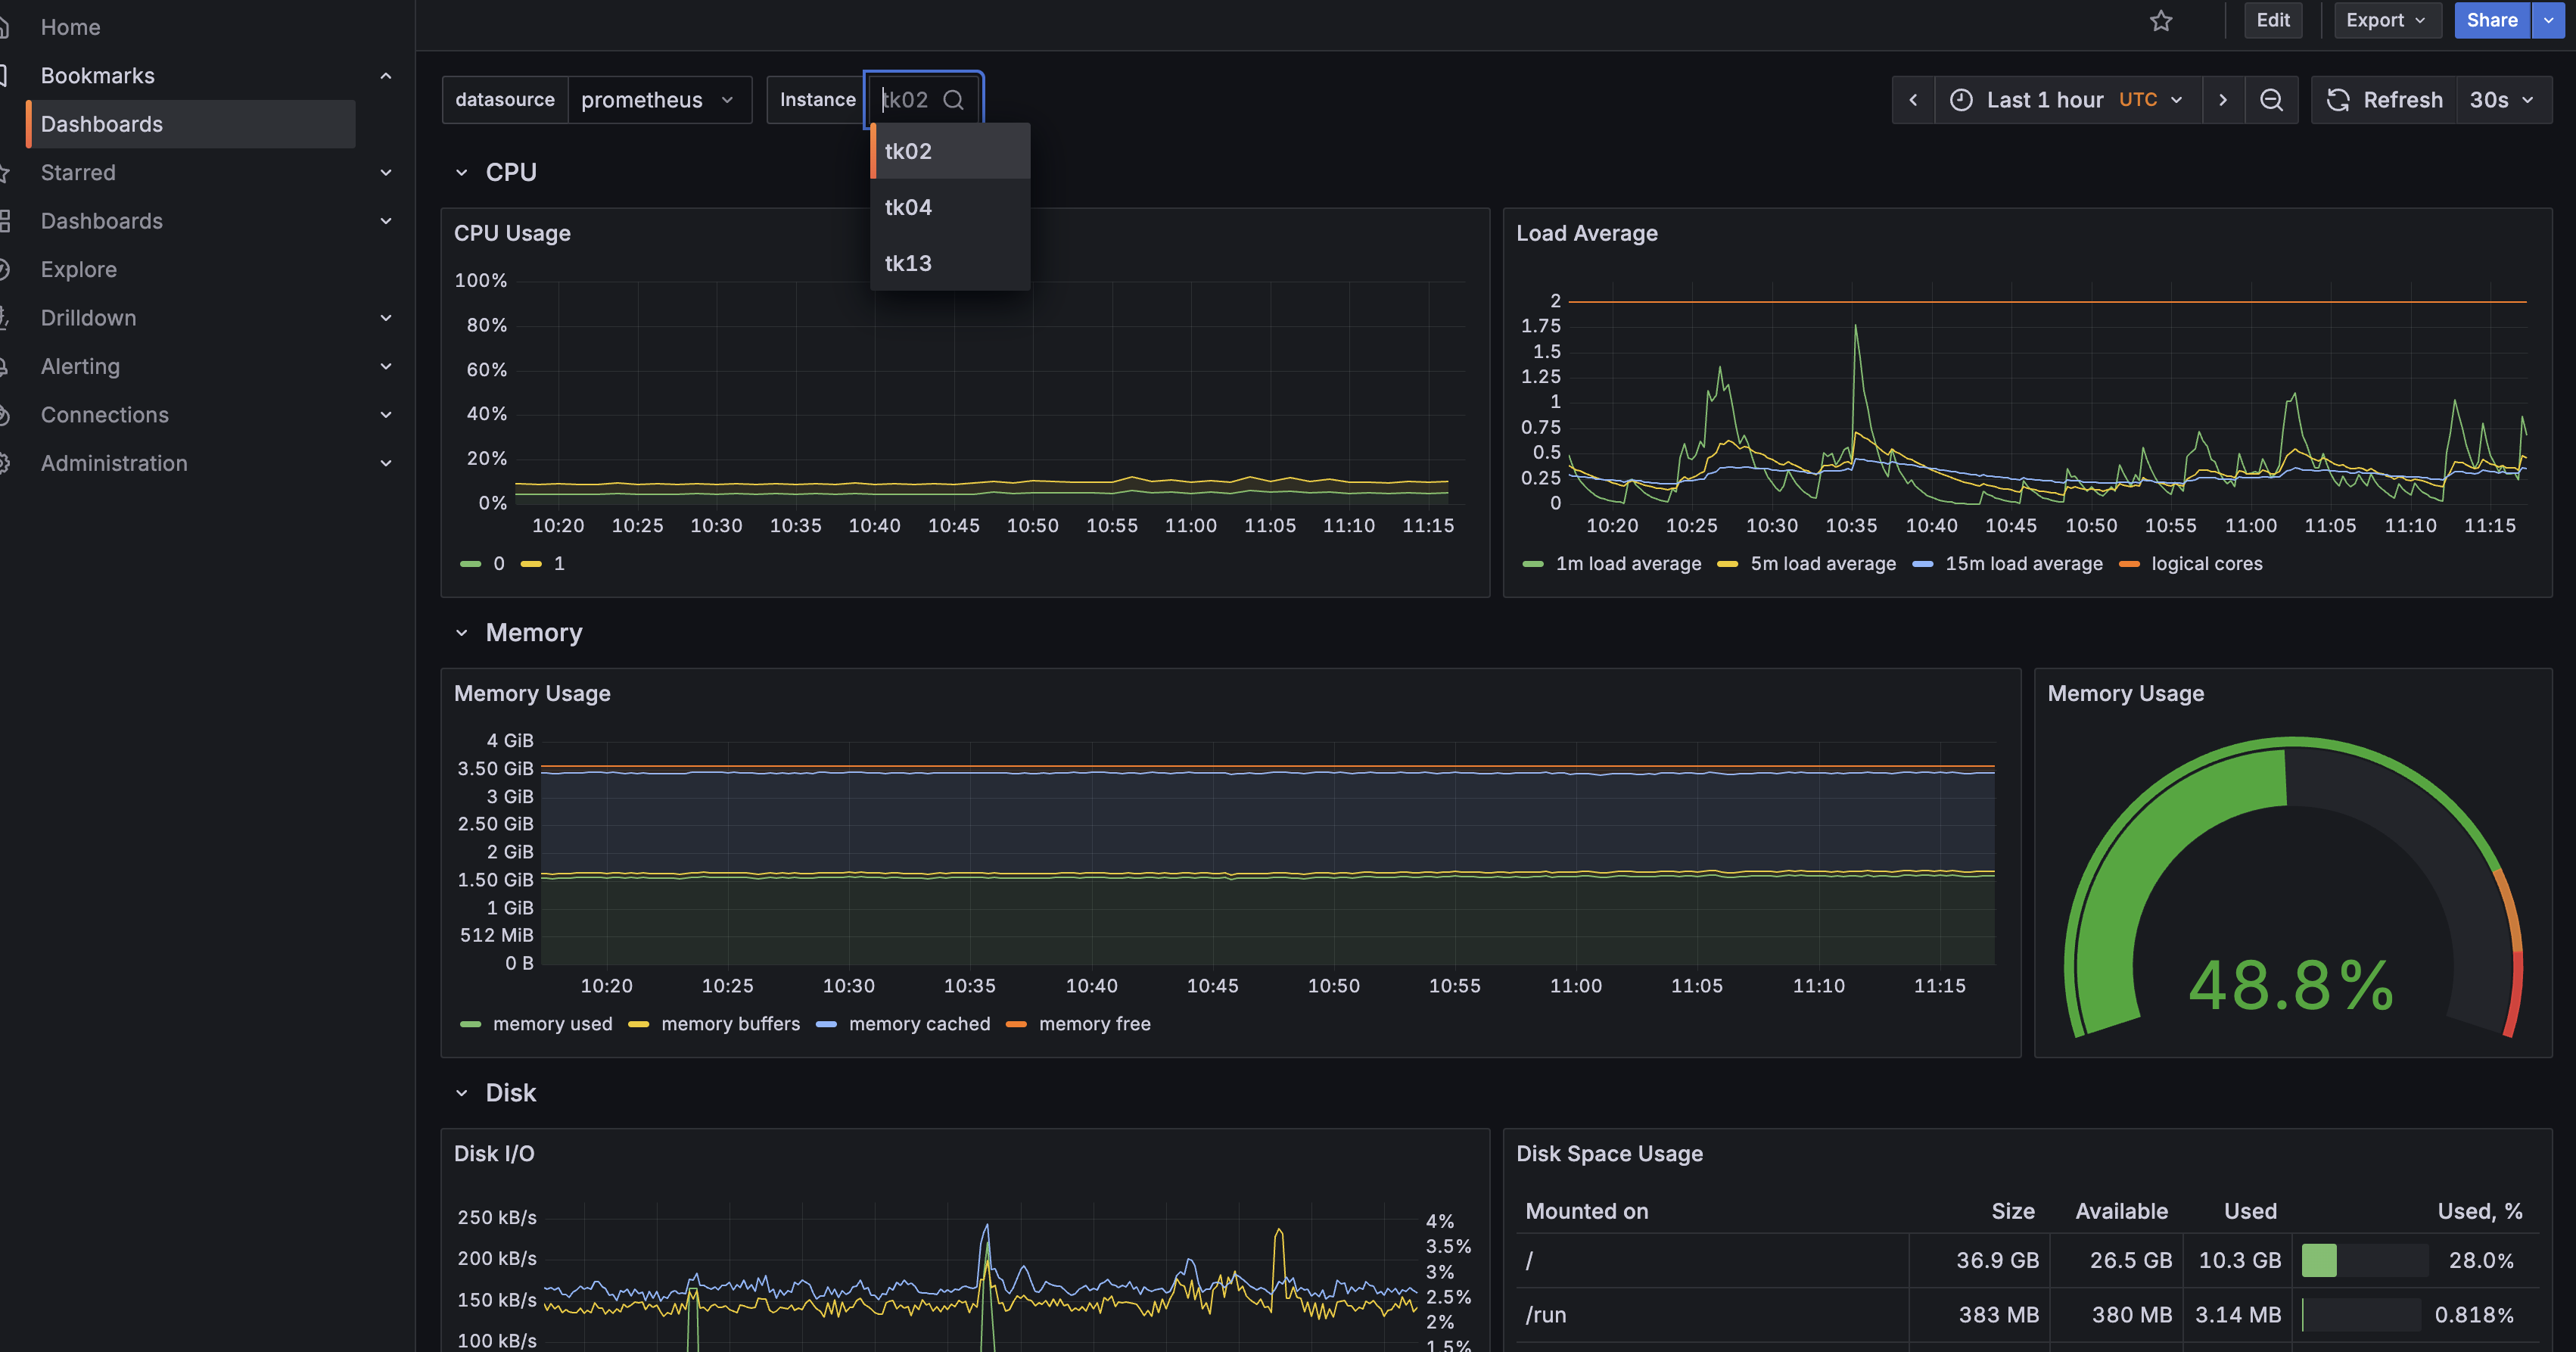
Prometheus 提供了基本的图形界面用来数据的可视化,但其展示效果一般,因此 Prometheus 官方更推荐使用 Grafana 作为可视化工具,它提供了比较完善的图表选项和 UI 操作,同时针对主流的组件,社区提供了大量的监控大盘模版,通常直接导入使用即可。
除了用于监控大盘展示,指标还需要拿来做告警,用来及时发现系统异常。Prometheus 提供了 Alertmanager 组件来处理告警。我们只需要配置好告警规则,一旦满足条件,Alertmanager 就会发送告警通知。下面是一个告警规则的示例:
  - name: k8s.rules.container_cpu_limits
    rules:
    - expr: |
        kube_pod_container_resource_limits{resource="cpu",job="kube-state-metrics"}  * on (namespace, pod, cluster)
        group_left() max by (namespace, pod, cluster) (
          (kube_pod_status_phase{phase=~"Pending|Running"} == 1)
        )
      record: cluster:namespace:pod_cpu:active:kube_pod_container_resource_limits
    - expr: |
        sum by (namespace, cluster) (
            sum by (namespace, pod, cluster) (
                max by (namespace, pod, container, cluster) (
                  kube_pod_container_resource_limits{resource="cpu",job="kube-state-metrics"}
                ) * on(namespace, pod, cluster) group_left() max by (namespace, pod, cluster) (
                  kube_pod_status_phase{phase=~"Pending|Running"} == 1
                )
            )
        )
      record: namespace_cpu:kube_pod_container_resource_limits:sum